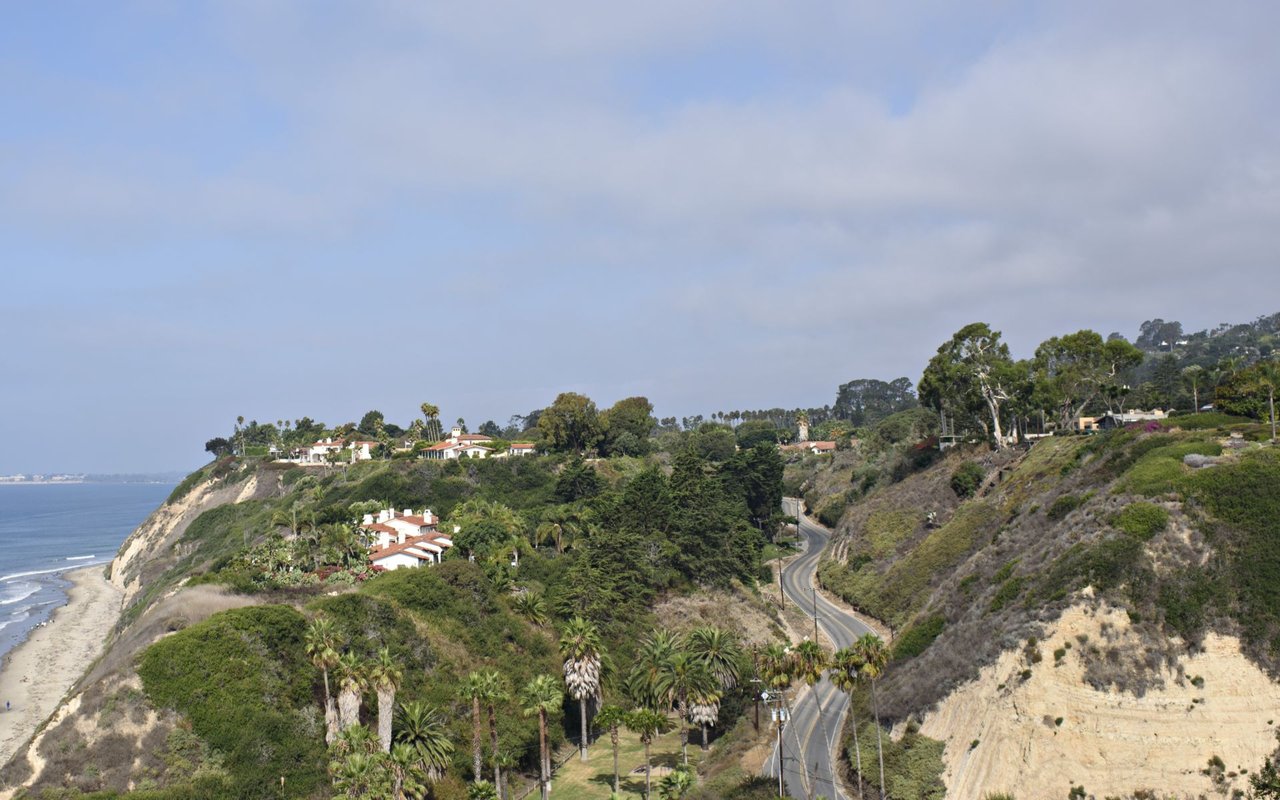
Local statistics in this report are from Santa Barbara MLS (FlexMLS) data for single-family homes and PUDs on the South Coast (Santa Barbara, Montecito, Goleta, Carpinteria and Summerland). June 2026 sales and year-to-date figures run through June 30, 2026. Duplicate MLS records are removed.
Nationally, the National Association of Realtors reported 4.6 months of inventory in June, and Redfin counted roughly 48% more sellers than buyers across the country. Santa Barbara sits near 2.8 months of supply, with homes selling for a median of about 98% of their final list price after an average of 37 days on market. Inventory here is tightening while the country's is climbing.
Understand why. Santa Barbara has always lagged national shifts by roughly six months. Right now we look closer to a year behind. That gap is a gift, not a guarantee, and historically our recovery arrives faster than most markets when the turn comes.
The Headline Decline Is a Mix Shift
You will hear the median is down 15.5% year to date, from $2,512,500 to $2,124,000. Remove Hope Ranch and Montecito and it's down less than 5%. The average sold price fell just 0.7%, from $3,603,222 to $3,578,620, while sold volume rose 4.7% to $1.81 billion on 506 sales, up 5.4%. Values are holding. The mix moved.
The Number Nobody Publishes: CDOM
June's most revealing data is cumulative days on market (CDOM), which counts every day a home has been listed, even across withdrawals and relistings. In the $3.0M to $3.25M band, days on market for June sales averaged 49, but CDOM was 132. From $3.25M to $3.5M: 71 versus 131. From $3.5M to $3.75M: 46 versus 137. One $4.95M sale showed 186 days on market versus 332 cumulative.
Below $2 million, DOM and CDOM are nearly identical (28 vs. 29). Above $3 million, true market time often runs two to three times the advertised figure. Buyers' agents pull CDOM before writing an offer. Withdrawing and relisting no longer resets anything.
Where June's Listings Died
Ninety-three homes sold in June. Another 26 were withdrawn, cancelled, or expired, and they cluster at the top. Cancelled listings carried a median list price of $3,100,000 and averaged $6,130,471. Expired listings had a median list price of $6,500,000 and averaged $7,804,000.
Yet 13 homes closed above $5 million, and 30 of 93 sales were $3 million-plus. Demand at the top is genuine. Overpricing at the top is fatal.
The Gap That Decides Your Fall
Current active listings carry a median list price of about $3,350,000 and an average of about $5,960,000, at roughly 98 days on market and 133 cumulative. June's median sale: $2,075,000. New listings are down about 8% year to date, active listings are down about 16% from a year ago, and homes in escrow are up slightly. Inventory is not the problem. Positioning is.
The Takeaway
Total sale price to list price slipped to 94.9% from 96.0% last June, pulled down by larger discounts on luxury homes, even as the typical home still sold close to asking. A tight market is a stable market, not an escalating one. Some homes are drawing bidding wars; many are not. The difference is almost never the property. It is whether the price creates a perception of value strong enough to make a buyer write an offer. Price to that, and our lag works for you.
June 2026 Market Snapshot
- Most Expensive Home Sold: $33,333,333 (3191 Padaro Ln)
- Least Expensive Home Sold: $360,000 (115 El Gaucho Ln, a Forest Service cabin); lowest conventional home: $955,000 (718 Cook Ave)
- Median Price Home Sold: $2,075,000
- Average Price Home Sold: $3,647,973
- Average Cumulative Days on Market: 50 days
Curtis Swan II
(805) 607-9709
Find my five-star reviews on RateMyAgent.